Expectation Ratings (ER)
The Expectaton Ratings (ER) survey is an attitudinal research method that captures the relationship between perceived and effective usability. It is particularly useful for prioritising user experience improvement tasks and redesign ideas.
William Albert and Eleri Dixon proposed the Expectation Ratings method at the Usability Professionals’ Association 12th Annual Conference in 2003, as a way to apply the expectancy disconfirmation theory to usability research and improve the popular Single Ease Question (SEQ) method.
Arguing that customer expectations are a primary driver for customer satisfaction, Albert and Dixon note how it is critical to capture the difference between expectations (perceived task difficulty) and experiences (actual task difficulty). For example, if a user expected a task to be very difficut, and completed it successfully but rated 1 (very difficult) on the SEQ scale, this does not necessarily impact user satisfaction negatively. On the other hand, if a user expected a task to be easy, but rated it 2 or 3 on the SEQ scale (difficult), this will negatively impact satisfaction. Using only the SEQ method, a researcher might incorrectly conclude that both such tasks are equally important to improve, or even that fixing the experience for the first task has a higher priority because the user rated it as more difficult. In reality, the second task is more important to fix.
Donna Tedesco and Tom Tullis conducted a research comparing various post-task rating methods, and found that the out of all applied methods, Experience Rating survey has the strongest correlation (0.46) between actual performance efficiency (task completion time and success) and the user attitudes after the task.
How to conduct an Expectation Ratings Survey
An Expectation Ratings survey has two parts: expectation rating and experience rating.
Before a usability testing session (before all the tasks), the participants rate their expected difficulty in performing various tasks. It’s important to collect the expectations at the very start, to avoid influencing the rating of later tasks by the work on earlier ones. Dixon and Albert used a five-point scale from “very easy” to “very difficult”, and collected the data about all tasks on a single form, such as the one below:
After each task, the participants rate the experience using a variant of the SEQ survey.
Tedesco and Tullis used a slightly modified version of the questions:
- “How difficult or easy to you expect this task to be?” (expectation rating at the start of the session, before all the tasks)
- “How difficult or easy did you find this task to be?” (experience rating after each task)
Using ER to prioritise improvement work
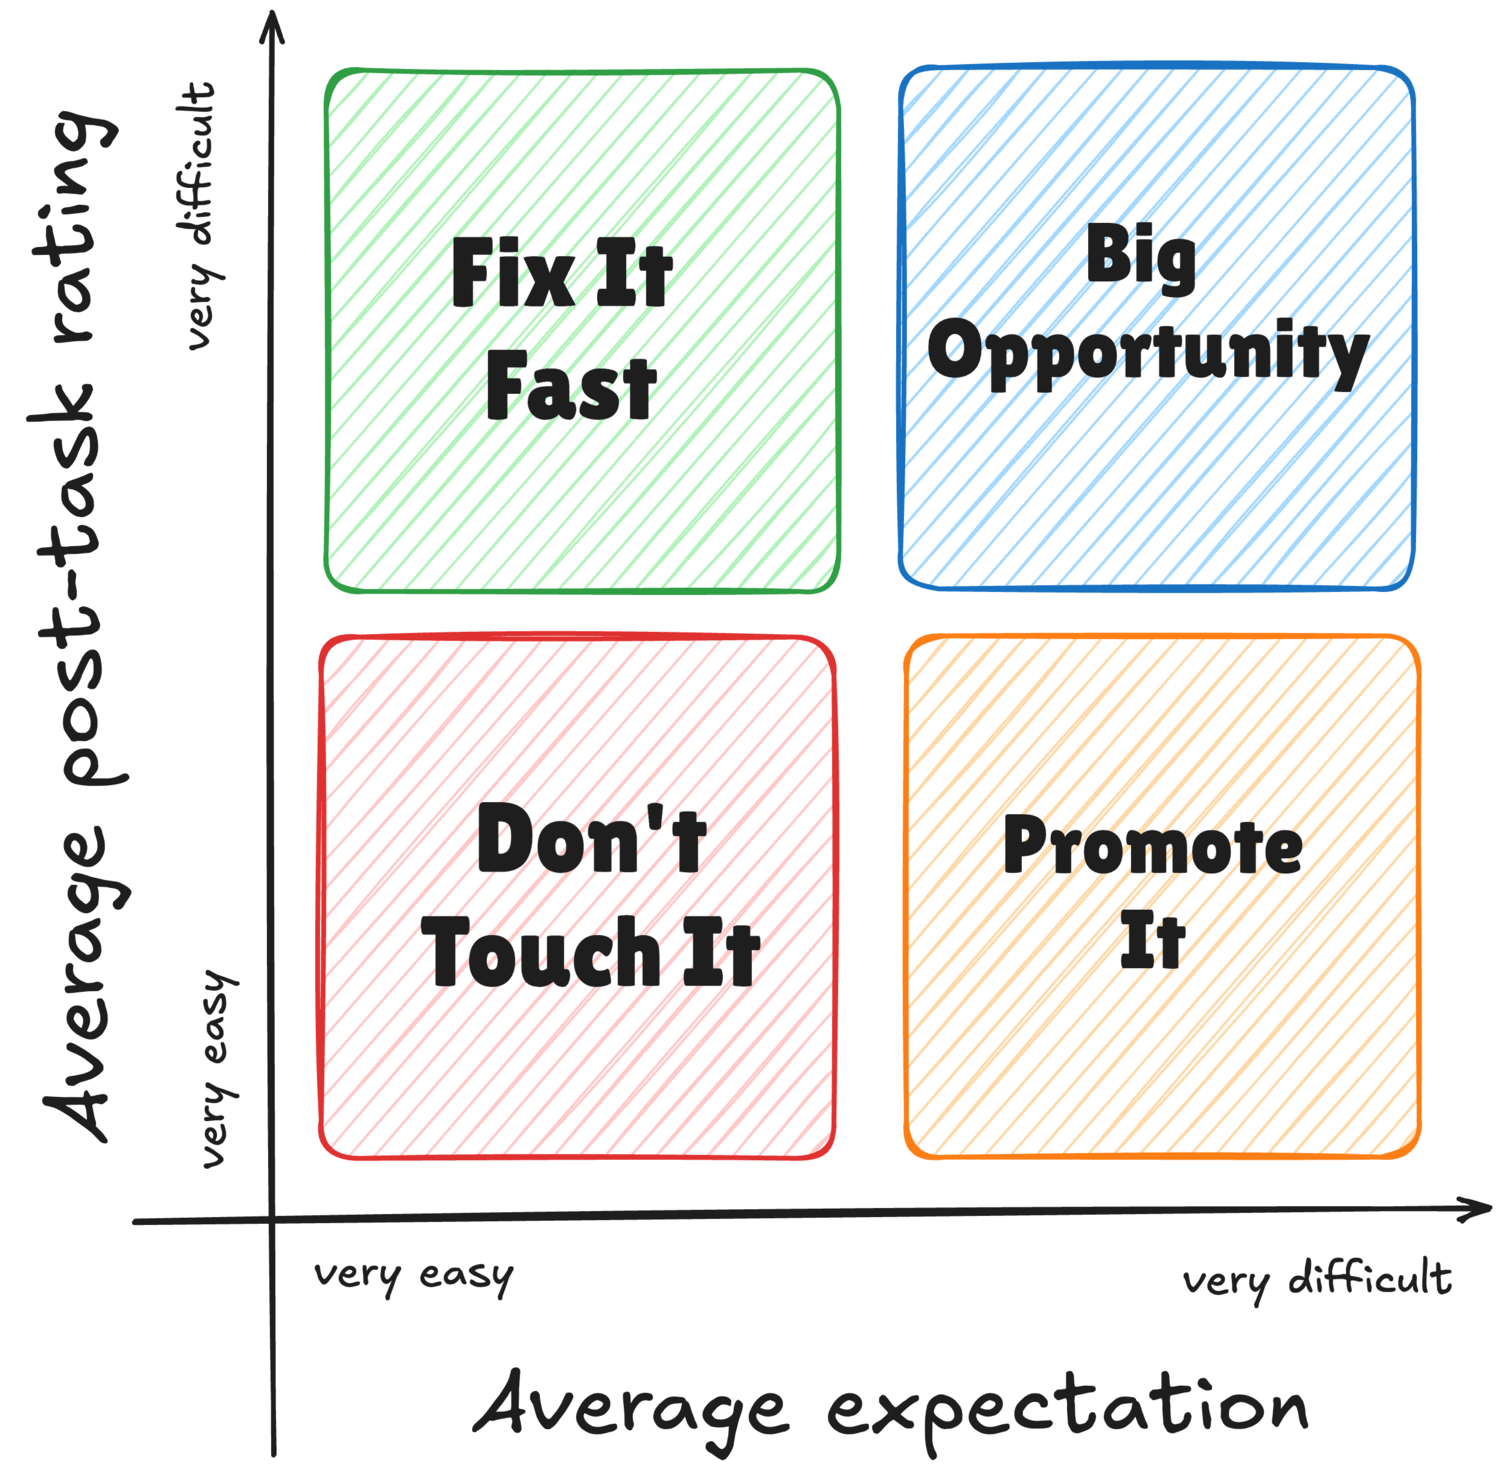
Albert and Dixon suggest a sample size of at least 12 people to get relevant results, plotting the average expected and experienced scores for each task on a graph, and then grouping items into four categories:

- Don’t Touch It: when the user expected a task to be easy, and it was easy, it’s unlikely that any design changes would increase satisfaction. In fact, the risk is that unexpected changes would decrease user satisfaction. Redesigns and interface improvements “should not interfere” with tasks in this group.
- Fix It Fast: when the user expected a task to be easy, but it was difficult, it’s likely that the customer satisfaction is negatively impacted by the current design. These tasks “deserve immediate attention in any redesign effort”, and should not be promoted or easily accessible in the user interface until the usability problems are fixed.
- Promote It: tasks that users expected to be difficult, but they were actually easy, can significantly increase user satisfaction. Albert and Dixon suggest using a “limited window of opportunity” to feature such tasks prominently in the user interface, before the user expectations adjust to their actual experience.
- Big Opportunity: tasks that were both perceived to be difficult, and they were difficult, are not particularly urgent to fix because they do not impact customer satisfaction negatively. Dixon and Albert suggest improving such tasks after those in the “Fix it Fast” category. By improving the user experience in this area, tasks usually switch into the “Promote It” category, becoming a driver of customer satisfaction.
Learn more about the Expectation Ratings Survey
- Is this what you expected? The use of expectation measures in usability testing, From the Usability Professionals' Association 12th Annual Conference by William Albert, Eleri Dixon (2003)
- A Comparison of Methods for Eliciting Post-Task Subjective Ratings in Usability Testing, from the Usability Professionals Association Conference by Donna Tedesco, Tom Tullis (2006)