Growth Pyramid
The Growth Pyramid (previously called The Startup Pyramid and The Startup Growth Pyramid) is a model for product evolution after the product/market fit. It provides guidelines and milestones that a product needs to achieve before significant growth.
The Growth Pyramid was originally defined by Sean Ellis in a blog post in 2009, based on common patterns he identified at Dropbox, LogMeIn, Uproar and several other high-growth companies. Various books and authors expanded or reproduced the pyramid with slight changes. The pyramid is most commonly shown with 3 levels, although the model evolved significantly over time, and the most recent version published by Ellis has 5 levels (see the section on variants below).
Evolving after product-market fit
The model is notable for mostly dealing with the evolution after a product achieves a product/market fit. Ellis warns against rushing into optimizing for growth before that threshold, so all the variants of the pyramid include the product/market fit as the base level. By measuring early traction, Ellis suggests checking if more than 40% of the users would be disappointed if a product disappeared from the market. If not, then it’s still too early to optimize for growth. If yes, then the product found a suitable market and it’s ready to grow.
Achieving product/market fit requires at least 40% of users saying they would be “very disappointed” without your product. Admittedly this threshold is a bit arbitrary, but I defined it after comparing results across nearly 50 startups. Those that struggle for traction are always under 40%, while most that gain strong traction exceed 40%.
– Sean Ellis
Ellis recommends surveying the users who would be very disappointed without the product, in order to identify the key benefits the product brings to that specific market segment. The product marketing should then focus on highlighting those benefits and exploiting that part of the market, as well as consolidating the business model and operations to support growth. The pyramid model helps to identify the individual steps to take next for that trajectory, and “race up the pyramid” to accelerate growth.
Variants of the Growth Pyramid
The Growth Pyramid evolved over time, shifting focus from startup work to general product growth, and reflecting the trends that emerged meanwhile in the product management community. This includes an explicit focus on observability and product experimentation, as well as the impact on organizational culture.
The Startup Pyramid with pre-scale steps (2009)
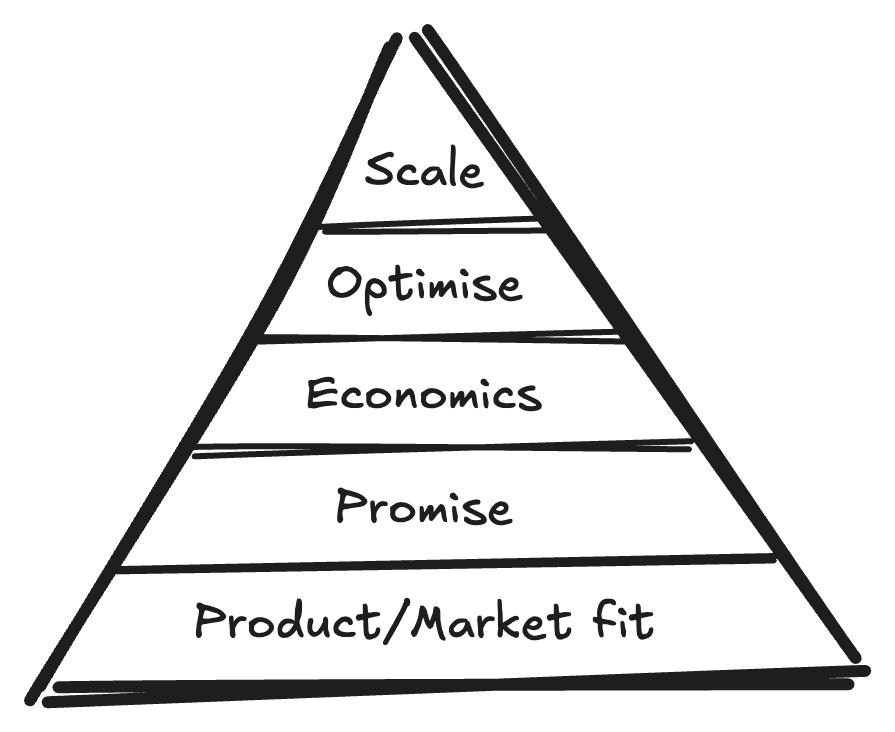
In the original 2009 blog post, Ellis listed 5 steps for what was then known as “The Startup Pyramid”. The purpose of the Pyramid was to highlight the pre-scale steps that, if effectively executed before growth, “improve the conversion rate to transactions by 5x or more”.

There are three key pre-scale steps in the 2009 model:
- Promise involves highlighting the benefits critical for the users in the market segment where the product discovered the fit. It’s common for products to evolve during the search for a market fit, and try addressing lots of different groups of users or customers. After the market fit, it should be clear which market segment is the most promising, so it’s important to re-focus marketing materials and the product experience on that.
- Economics involves developing a business model that allows the company to profitably acquire users at scale. Many products (especially those funded by venture capital investors) can afford to lose money on servicing and acquiring early customers, but this is usually not economically viable to continue into explosive growth. Notable counter-examples exist, of course, but unless you can persuade investors to burn money for you, it’s recommended to sort out the business model before growth.
- Optimize involves experimenting with different customer acquisition processes to find one that is scalable and repeatable.
The Startup Growth Pyramid, Transition to Growth and Unfair Advantage (2013)
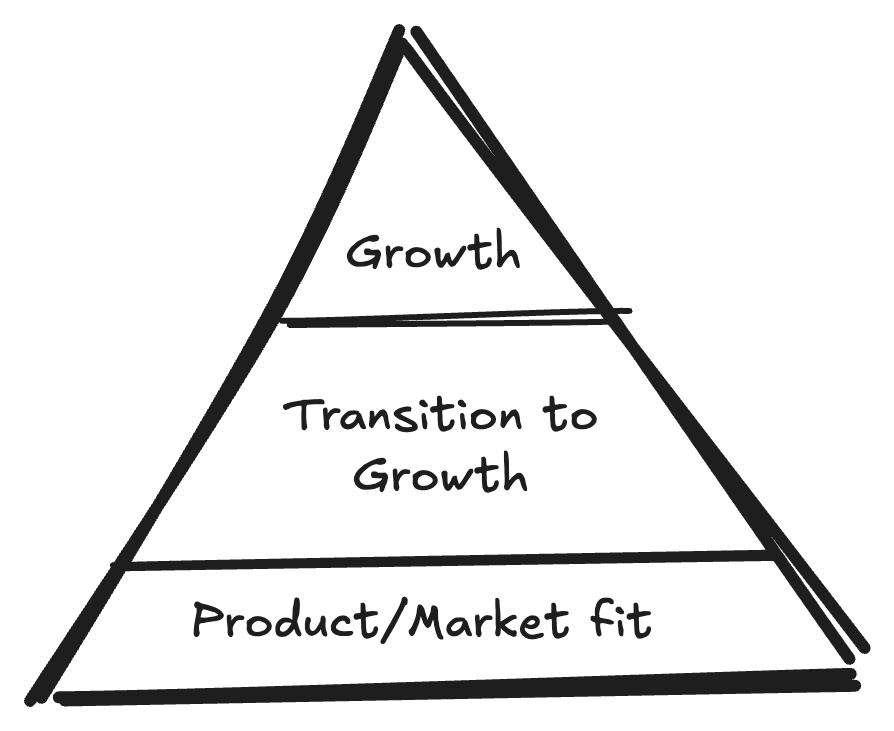
In 2013, Ellis updated the blog post to simplify the pyramid into just 3 steps, and started calling it “The Startup Growth Pyramid”.

In effect, this version just simplified the visuals, and the three “pre-scale steps” from the 2009 version were merged into “Transition to growth”. With a single level that incorporates all three activities, this version avoids implying a sequence between the pre-scale steps, as it’s possible to do them in parallel or in a different sequence.
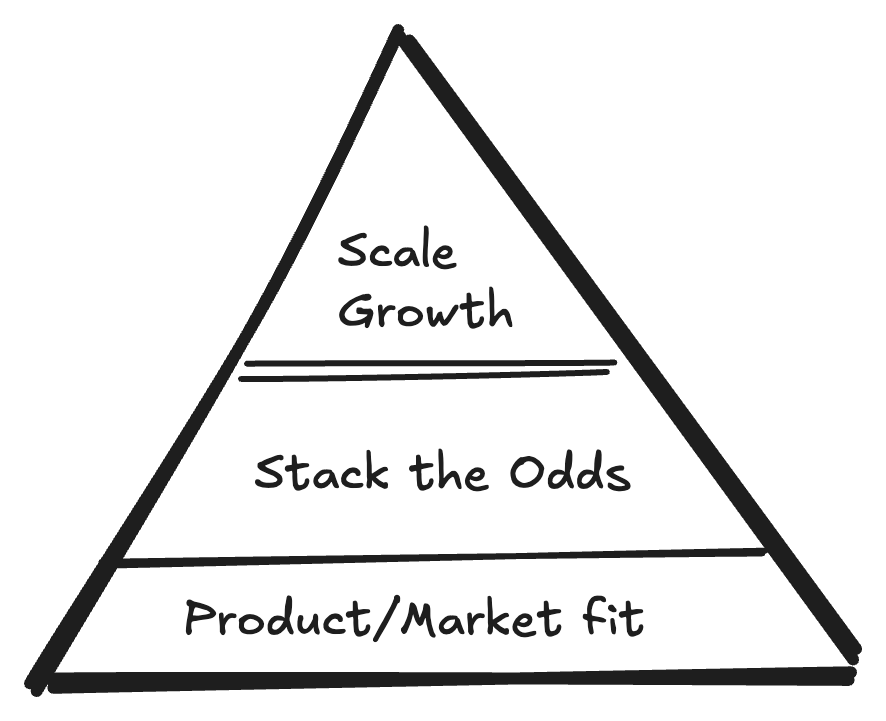
A slightly more significant change was included in the Lean Analytics book the same year, where the authors Yoskovitz and Croll further rename the three levels:
- Product/Market Fit: decide what you sell to whom, and prove it
- Stack the Odds: find a defensible unfair advantage and tweak it
- Scale Growth: step on the gas in new markets, products and channels

The Lean Analytics variant is interesting because it talks about focusing on a “defensible unfair advantage”. Although this was not explicitly mentioned in the original pyramid, it is potentially an interesting extra step to consider in transition to growth. The defensible unfair advantage could be in the “promise” part (you can offer some unique data or expertise that competitors can’t copy easily), the economics part (you can offer the service significantly cheaper than everyone else) or the customer acquisition part (your organic search performance is through the roof and competitors can’t easily achieve the same level of domain authority), or something potentially unrelated to Ellis’ three original steps (patents/competitive barrier to entry or similar).
The Growth Pyramid: Instrumentation and Organizational Alignment (2019)
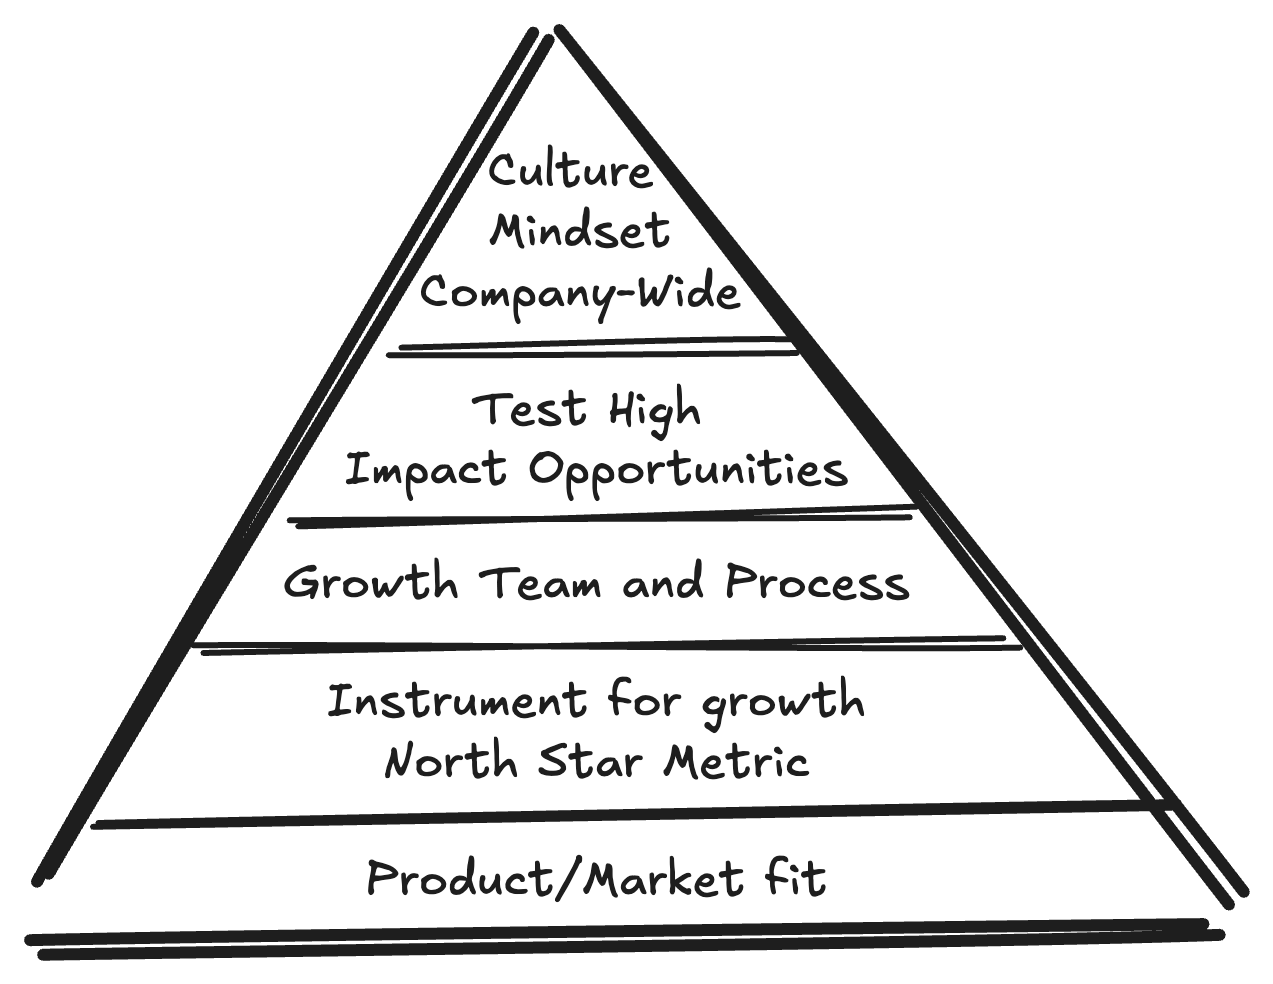
In 2019, Ellis published a revised version of the pyramid, switching back to 5 levels but with a different focus, and dropping the “startup” from the name. The most recent iteration of the pyramid focuses a lot on observability and organizational patterns, not just on the product.

The levels in the 2019 variant are:
- Product Market Fit
- Instrument for Growth & Define North Star Metric
- Growth Team, Process & Organized Learnings
- Align Team & Testing Around High Impact Opportunities
- Company-wide Growth Culture & Mindset
The “promise” part of the original pyramid evolved into defining the “North Star Metric” that helps to “track cumulative value delivered across a growing customer base”. This metric is important because it reflects the promise the product makes to the market, so it can be used to ensure that the product keeps delivering the value as it grows. According to Ellis, the North Star metric is also a much more sustainable growth indicator than user interactions such as registrations and downloads, or lagging business indicators such as revenue. (In the Value Exchange Loop terminology, this metric should track the value delivered to the market).
In addition to defining the key metric, Ellis also specifically calls out instrumenting the product with observability features that can help track and understand growth. Products can achieve a market fit without strong instrumentation and observability capabilities (or with ad-hoc hacks for A/B testing), but systematic observability infrastructure becomes crucial for further growth. The second step is then effectively about building the technical infrastructure for running experiments at scale.
The third milestone involves building a team that can execute the growth process. Effectively, this step builds the internal organizational capability to run experiments at scale. The team should start running tests and then identifying how to make them cheaper, faster and more efficient, before actually trying to accelerate growth. According to Ellis, “Your goal here is just to build a rhythm and habit of testing”. The Experimentation Growth Model can be particularly useful here as a template for evolving testing capabilities. A good threshold indicator when the organization has reached the capability to run tests effectively is being able to run 2-3 experiments per week.
The fourth milestone is to identify the highest impact opportunities and ensure that the growth team has the resources and management support to test around those opportunities. Effectively this removes the obstacles to growth experimentation at scale.
The fifth step is to expand the culture and mindset of experiments beyond just the growth team, and get others involved for more impact.
Learn more about the Growth Pyramid
- The Growth Pyramid Revisited by Sean Ellis (2018)
- The Startup Pyramid by Sean Ellis
- Lean Analytics: Use Data to Build a Better Startup Faster, ISBN 978-1098168186, by Alistair Croll, Benjamin Yoskovitz
- Milestones to Startup Success by Sean Ellis