Levels of Evidence
The Levels of Evidence model (also called the Hierarchy of Evidence) ranks trustworthiness of different types of information. It was originally created for critically analysing medical research papers and therapy studies. The model is interesting from a product management perspective as a way to systematically apply a confidence score for prioritisation systems, such as ICE or Impact Estimation Tables.
- The Levels of Evidence Pyramid
- Applying Levels of Evidence to Product Management
- Numerical confidence scoring
Trisha Greenhalgh described the Levels of Evidence model is the book How to Read a Paper, as a way of quickly showing “to what degree information can be trusted”.
All evidence, all information, is not necessarily equivalent. We need to keep a sharp eye out for the believability of whatever information we find, wherever we find it.
Trisha Greenhalgh, How to Read a Paper
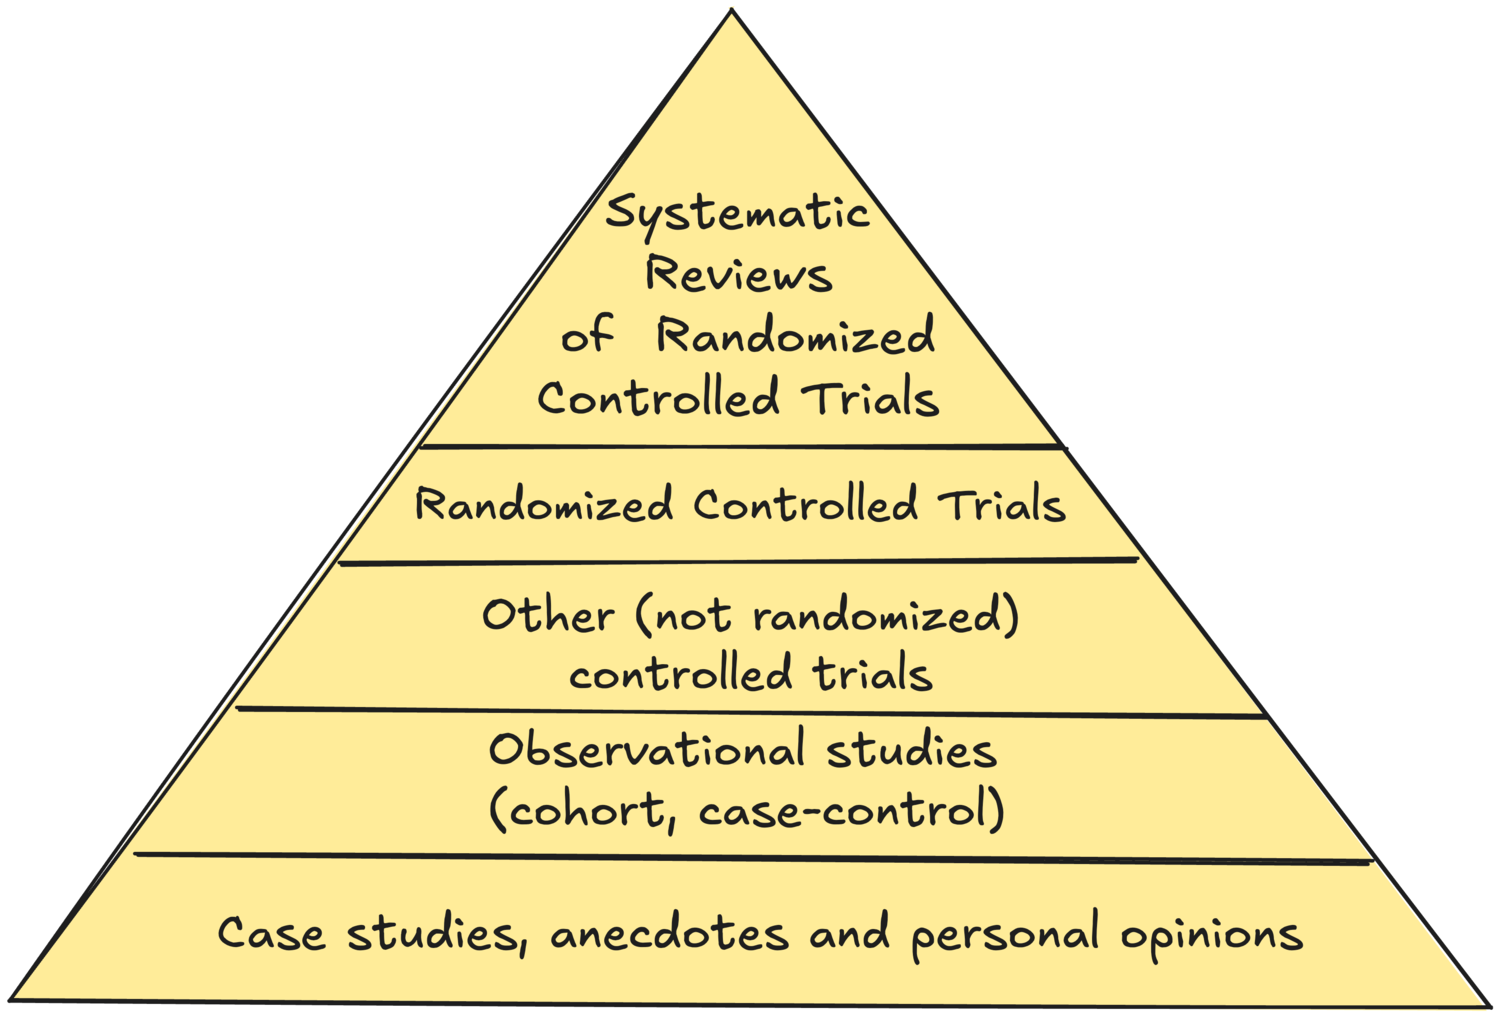
The Levels of Evidence Pyramid
The Levels of Evidence model is usually shown as a pyramid, with more trustworthy levels higher up, and less trustworthy levels lower in the pyramid. Expert opinions, anecdotes and case studies are at the base of the pyramid. Observational studies (such as case-control studies or cohort studies) are more trustworthy than opinions. Field (clinical) trials are more trustworthy than observations. Randomized controlled trials are more trustworthy than non-randomized studies. Systematic reviews of randomized controlled trials are at the top of the pyramid.

(open the image in a new tab)
The Oxford Centre for Evidence-Based Medicine has several similar models for various purposes (diagnosis, treatment benefits, prognosis…). From a product management perspective, the most applicable model is the one for evaluating treatment benefits. It mostly follows the same structure as Trisha Greenhalgh’s pyramid, with the difference of including historically controlled studies at the same level as case studies, recognising that things change over time and that the results of older experiments may not be as valid as recent ones.
Antoine Lentacker presents an interesting consideration in the 2022 paper Epistemology of the side effect: anecdote and evidence in the digital age, exploring how a popular web site for reporting and evaluating side-effects of medical treatments helps to complement data collected through research. In effect, all research is based on small samples and statistical analysis, and product managers need to pay attention to the actual usage data, particularly if it starts to conflict with research results or surfaces unexpected side-effects.
Applying Levels of Evidence to Product Management
Many software product methods require some kind of a confidence adjustment or score, but this is often just done intuitively. The Levels of Evidence model can serve as a systematic guideline in such cases, avoiding personal bias. In addition, product managers often need to plan work in a way that gradually increases confidence for high-risk initiatives. The model suggests a logical progression of steps to take in order to gain more confidence.
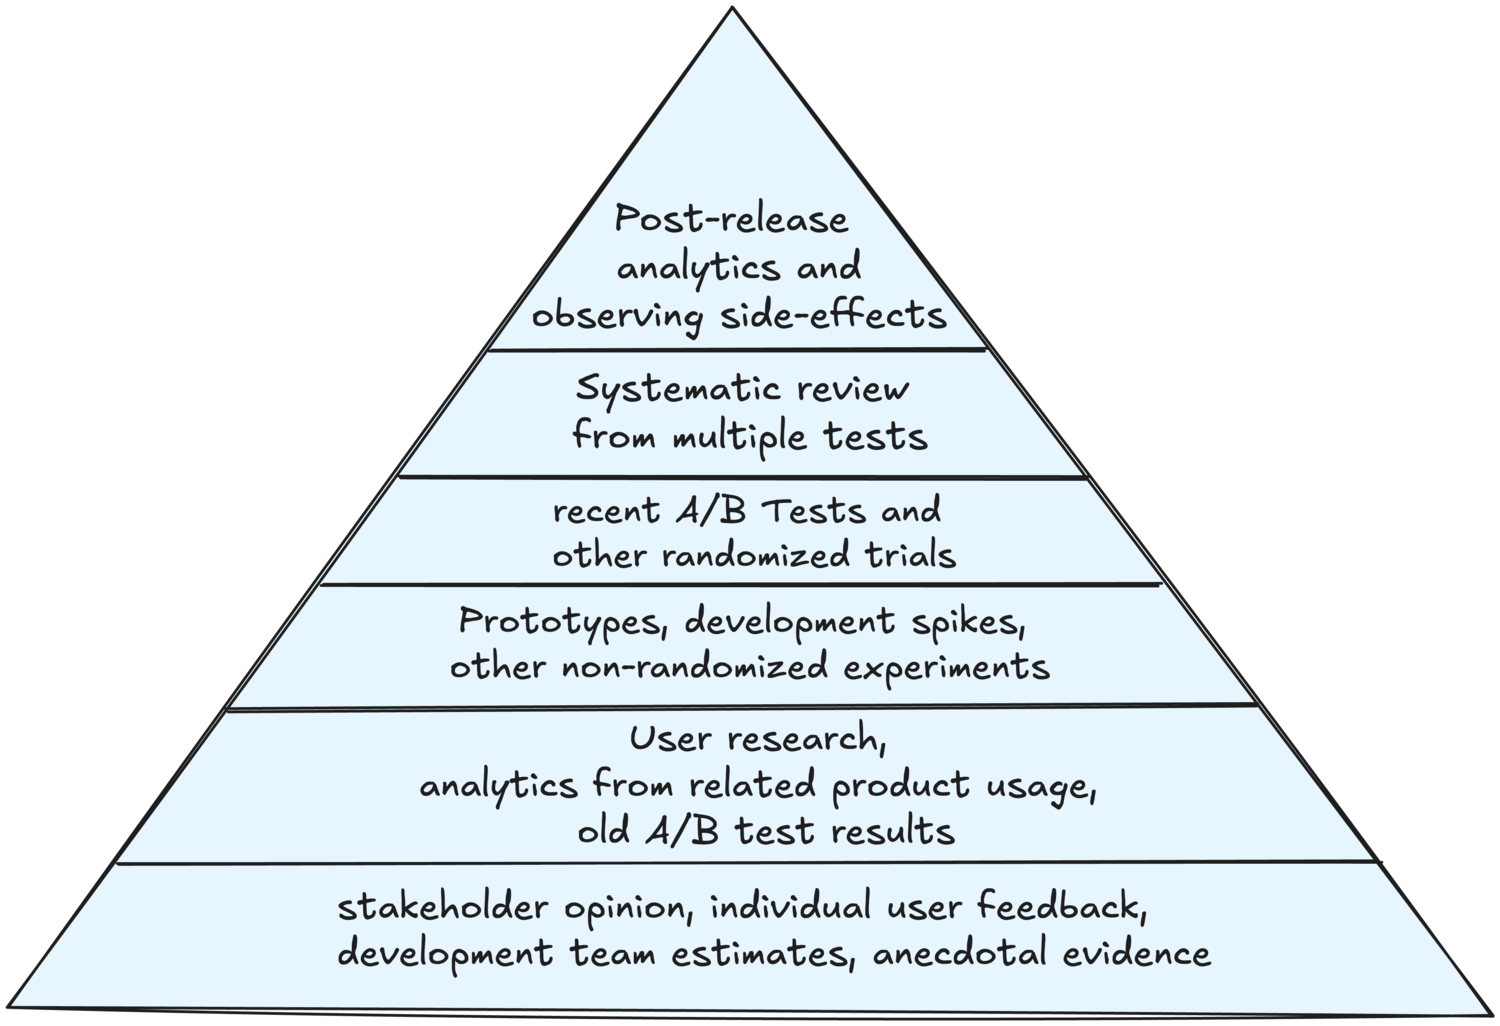
Drawing parallels between the medical models and the information available to product managers, personal opinions and anecdotal evidence correspond to stakeholder opinions, customer and user feedback or subjective scoring by the product development team. Observational studies correspond to larger user surveys or UX research. Field trials correspond to prototyping and non-randomized user experiments. Randomized controlled trials directly correspond to A/B testing. Systematic reviews correspond to aggregated insights from multiple A/B tests, offering high confidence for risky decisions. Extending the model using Antoine Lentacker’s insights, the model can get one more level. The actual product usage data from a large population, especially when related to unexpected side-effects, is more trustworthy than combined test data from any research.

(open the image in a new tab)
Numerical confidence scoring
Models like RICE, ICE, and impact estimation tables explicitly require some way of scoring confidence to evaluate opportunities. The Levels of Evidence model can be used as an good basis for a scoring system.
The problem with translating the levels into numerical scores is that numbers are only valid for relative comparisons, but they usually suggest a non-existent proportional relationship. For example, if we assign a score of 2 to prototypes and a score of 3 to A/B tests, this would suggest numerically that A/B tests are 50% more trustworthy than prototypes, or that two combined prototypes become more trustworthy than an A/B test. In reality, there’s no amount of prototyping that is more valuable than an A/B test with actual users, and the numerical proportion between those two levels simply doesn’t exist. To reduce the effects of mathiness, it’s good to assign values with different orders of magnitude. Even better, use a symbolic system instead of numbers whenever possible, such as trust levels or t-shirt sizes.
Here is a potential scoring model, ranging from 1000 to 0.01.
Trustworthiness levels, T-Shirt sizes and numerical scoring
| Information source | Trust | T-Shirt size | Score |
|---|---|---|---|
| Post-release analytics and observing side-effects | Reality | XXL | 1000 |
| Systematic review from multiple A/B tests | Very High | XL | 100 |
| Recent A/B tests and other randomized trials | High | L | 10 |
| Prototypes, development spikes, non-randomized tests | Moderate | M | 1 |
| User research, analytics from related product usage, old A/B test results | Low | S | 0.1 |
| Stakeholder opinion, individual user feedback, development team estimates, anecdotal evidence | Very low | XS | 0.01 |
For a similar scoring model that provides more granular scores at lower levels of confidence, see Itamar Gilad’s Confidence Meter.
Note that any scoring system like the one above will be highly context dependent. Use the table above just as an example to build your own model. When developing a custom model, check out the OCEBM tables to review if one of the other sequences from that group would suit your needs better.
Learn more about the Levels of Evidence
- How to Read a Paper: The Basics of Evidence-based Medicine and Healthcare, 6th Edition, ISBN 978-1119484745, by Trisha Greenhalgh
- The Oxford Levels of Evidence 2 by OCEBM Levels of Evidence Working Group (2011)
- Epistemology of the side effect: anecdote and evidence in the digital age, from Biosocieties, volume 19 by Antoine Lentacker (2022)