Opportunity Solution Tree
An Opportunity Solution Tree is a visual representation of different ways a product can achieve a business outcome, showing various product opportunities, solutions and assumptions. By clearly visualising underlying assumptions and product opportunities, it helps to avoid Air Sandwich plans.
Opportunity Solution Trees were introduced by Teresa Torres in 2016 and described in detail in her 2021 book Continuous Discovery Habits.
The structure of an Opportunity Solution Tree
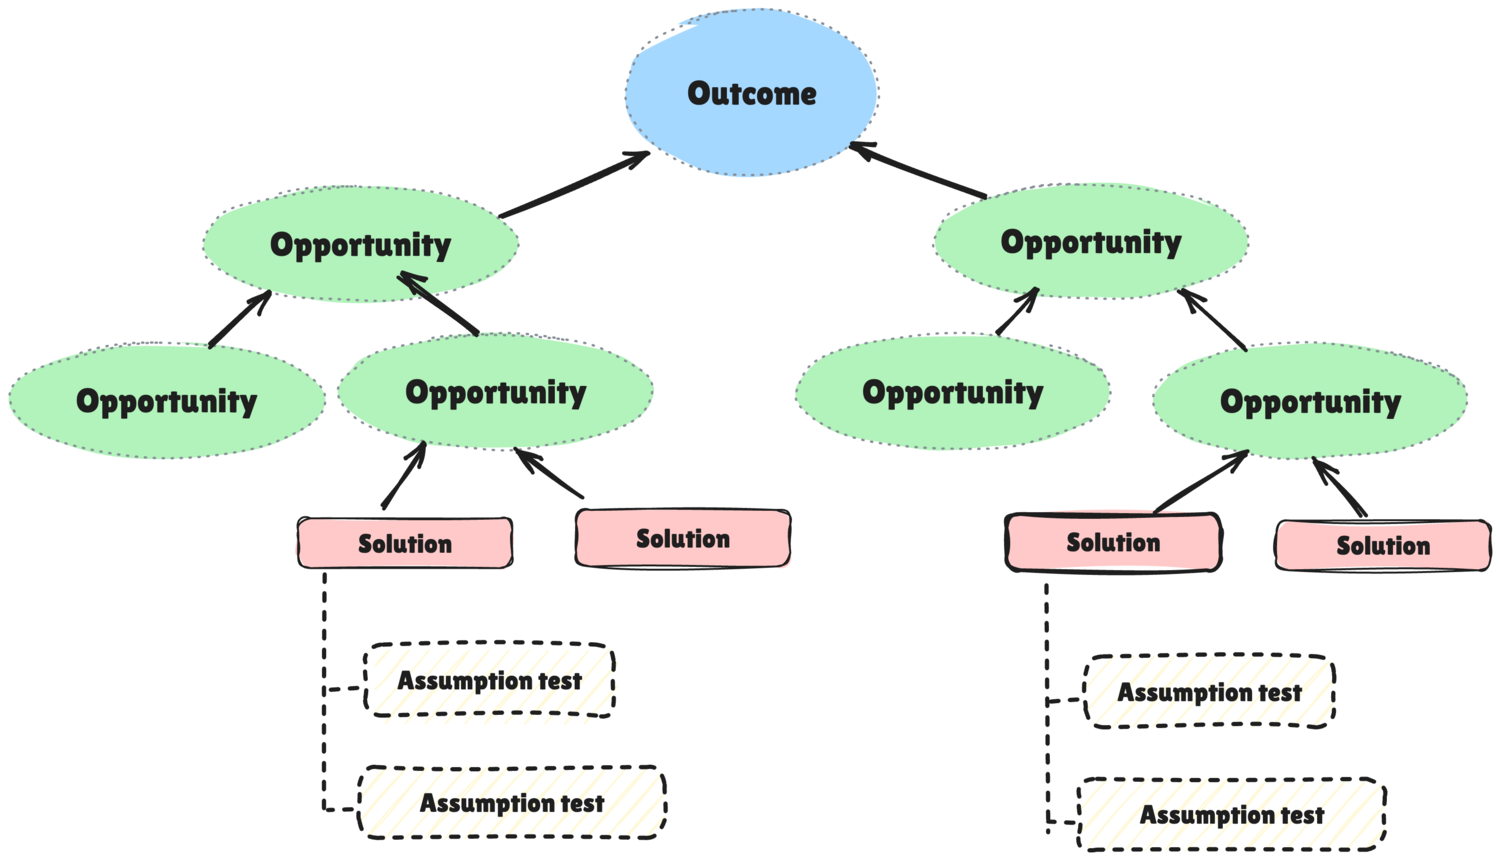
An Opportunity Solution Tree is a visual hierarchy, usually presented top-down, starting from a single outcome (the “business need that reflects how your team can create business value”, effectively the captured value part of the Value Exchange Loop. It then breaks into several levels of product opportunities, which are “customer needs, pain points, and desires that, if addressed, will drive your desired outcome”), showing the delivered value part of the Value Exchange Loop. Under key opportunities, the tree presents potential solutions that can exploit those specific opportunities, followed by the key assumption tests for those solutions.

(open the image in a new tab)
Before creating an Opportunity Solution Tree, it’s often useful to first create a Customer Experience Map.
Opportunity Solution Tree example
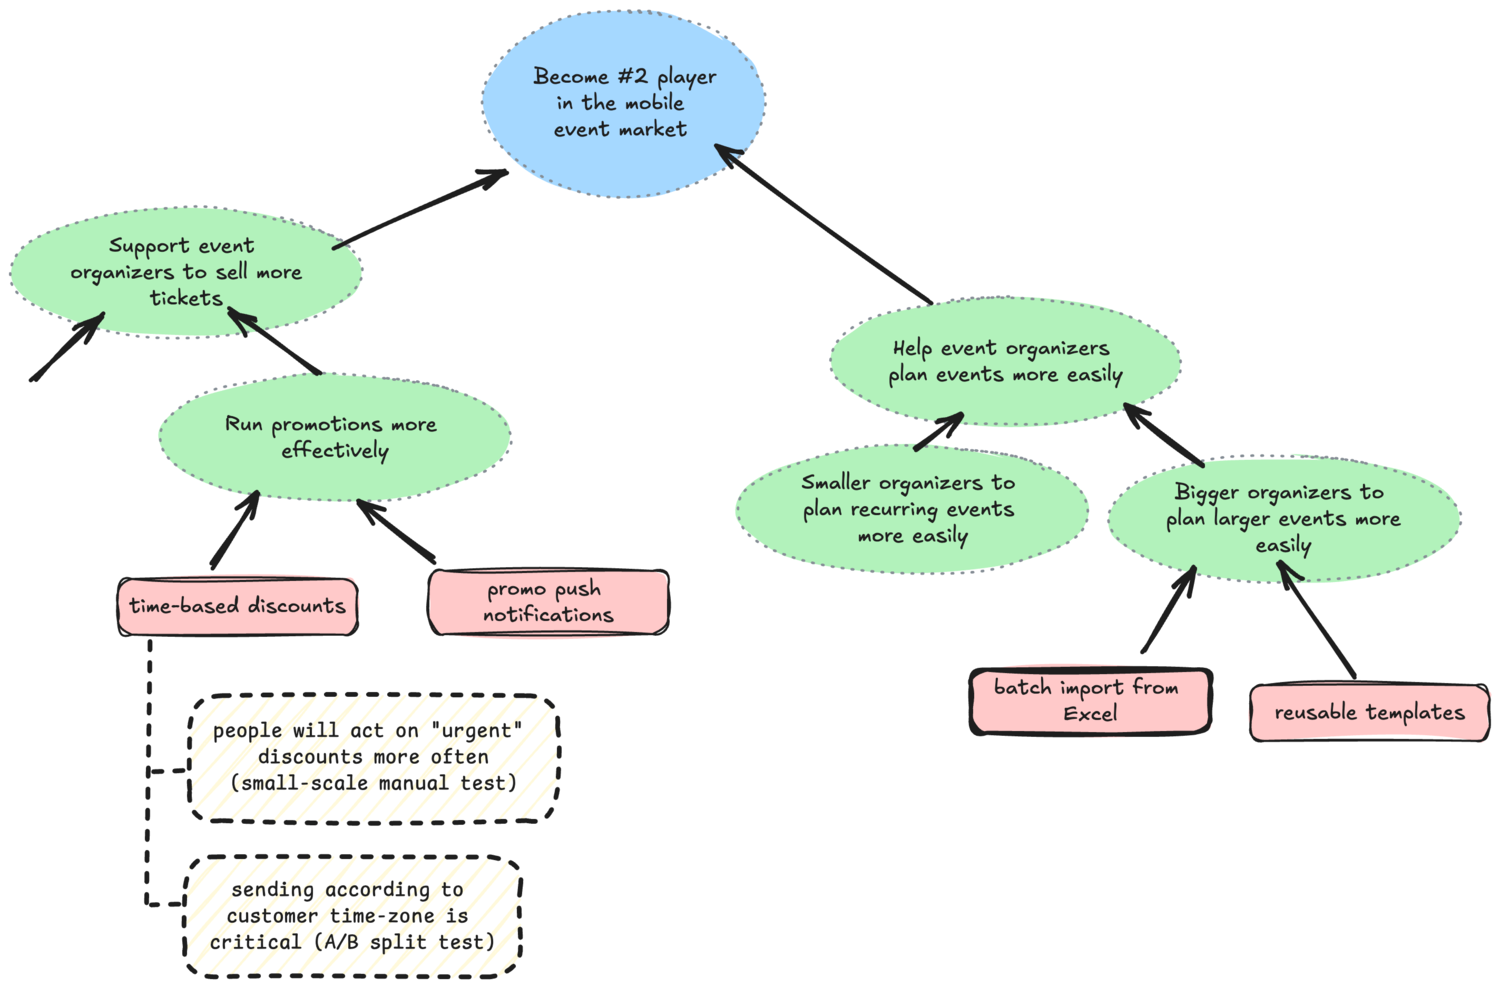
Here is a concrete example. Imagine an application that helps event organizers sell tickets to event attendees. The overall product business goal for the current milestone might be to increase market share. A product can do that by exploiting several opportunities, that might be unfulfilled needs or event organizers such as more easily running discount campaigns or spending less time on setting up ticket sales for recurring events. One good solution might be timed discount campaigns, and the underlying assumptions are that ticket buyers will act more on messages that contain a sense of urgency than regular notifications, and that the key to get people to act quickly is to deliver a message at the time when they are likely to read it.
An opportunity Solution Tree showing that would look similar to the one in the image below:

(open the image in a new tab)
Benefits of Opportunity Solution Trees
According to Torres, visualising Opportunity Solution Trees helps product teams resolve the tension between business needs and customer needs, build and maintain a shared understanding how to reach the desired outcomes, speed up learning and improve decision making, improve confidence and help with stakeholder discussions.
As a visual hierarchy, Opportunity Solution Trees promote the idea that there are multiple options for achieving the same things, and directly show how different options relate to each other. By listing opportunities explicitly, and showing how lower-level opportunities contribute to higher-level opportunities, this visualisation helps to move away from focusing on outputs and instead targeting outcomes. By showing the big picture view of how individual solutions can contribute to exploit opportunities and then fulfil business objectives, the trees help teams communicate with stakeholders and prioritise work. At the same time, by explicitly listing key assumption tests, the Opportunity Solution Trees help to take delivery steps with confidence.
How Opportunity Solution Trees compare to Impact Maps
Opportunity Solution Trees and Impact Maps overlap significantly in intention and visualisations, but they focus on different objectives. An Opportunity Solution Tree is focused on enabling continuous product discovery. Impact Maps are focused on driving finding quick paths towards business outcomes. Both visualisations start with the business value (“outcome” in the terminology of Opportunity Solution Trees or “Goal” in the terminology of Impact Maps), and connect to product ideas (“Solutions” in case of Opportunity Solution Trees or “Deliverables” in the terminology of Impact Maps) through a set of user and customer value items. Both promote the idea that there are multiple options to create value for users, and that different ways of creating value for users can contribute to the overall business outcome. The visualisations differ significantly in the connecting part. Impact Maps require strict impact descriptions that are ideally measurable through behaviour changes, where Opportunity Solution Trees allow different types of needs, wants and desires to serve as opportunities. That makes Impact Maps perhaps more directly applicable for measuring progress and focusing delivery. On the other hand, an Opportunity Solution Tree is be more flexible and could better support brainstorming and discussions for complex opportunities. For example, an Opportunity Solution Tree explicitly provides a way to break down complex opportunities into sub-opportunities and visualise that relationship, so it can show dependencies between needs of different types of customers and users (for example, that getting visitors to act on more ads helps advertisers in a two-sided marketplace). Impact maps split the hierarchy across different types of actors, and there is no systematic way to show that kind of relationship. An Opportunity Solution Tree also explicitly lists assumptions under solutions, and tests for those assumptions. With Impact Maps, assumptions are implicit in the links between deliverables and impacts, but are not explicitly set out.
How Opportunity Solution Trees compare to GIST
Compared to the GIST method, Opportunity Solution Trees are more focused on product discovery, where GIST is more focused on execution strategy. Both methods visualise similar things, however an Opportunity Solution Tree shows a much more detailed view of the assumptions, and GIST shows a much more detailed view of how to test those assumptions. With GIST, the Goals usually track user and business value through a pair of metrics, and an Opportunity Solution Tree presents a hierarchical breakdown of the relationships, allowing for many different types of metrics on different levels. With GIST, such a breakdown of metrics is usually managed with Objectives and Key Results and presented somewhere outside the GIST board. Opportunity Solution Trees show tests for various assumptions of a solution, which translate to Steps and Ideas in the GIST terminology, but GIST in addition breaks down steps (assumption tests) into individual tasks that can be taken up by delivery teams. GIST is also a lot more systematic in iteratively increasing confidence in ideas by performing steps, where Opportunity Solution Trees just list the key tests for the assumptions. In effect, Opportunity Solution Trees focus on testing assumptions and driving product discovery, GIST focuses on testing ideas and navigating product development.
Learn more about the Opportunity Solution Tree
- Why This Opportunity Solution Tree is Changing the Way Product Teams Work by Teresa Torres (2016)
- Continuous Discovery Habits: Discover Products that Create Customer Value and Business Value, ISBN 978-1736633304, by Teresa Torres (2021)